« Get Pull Request metrics with chat-gpt 27 Mar 2023
I woke up early morning today and took some minutes to read this blog post about
engineering delivery metrics while grabbing my early morning coffee ![]() .
.
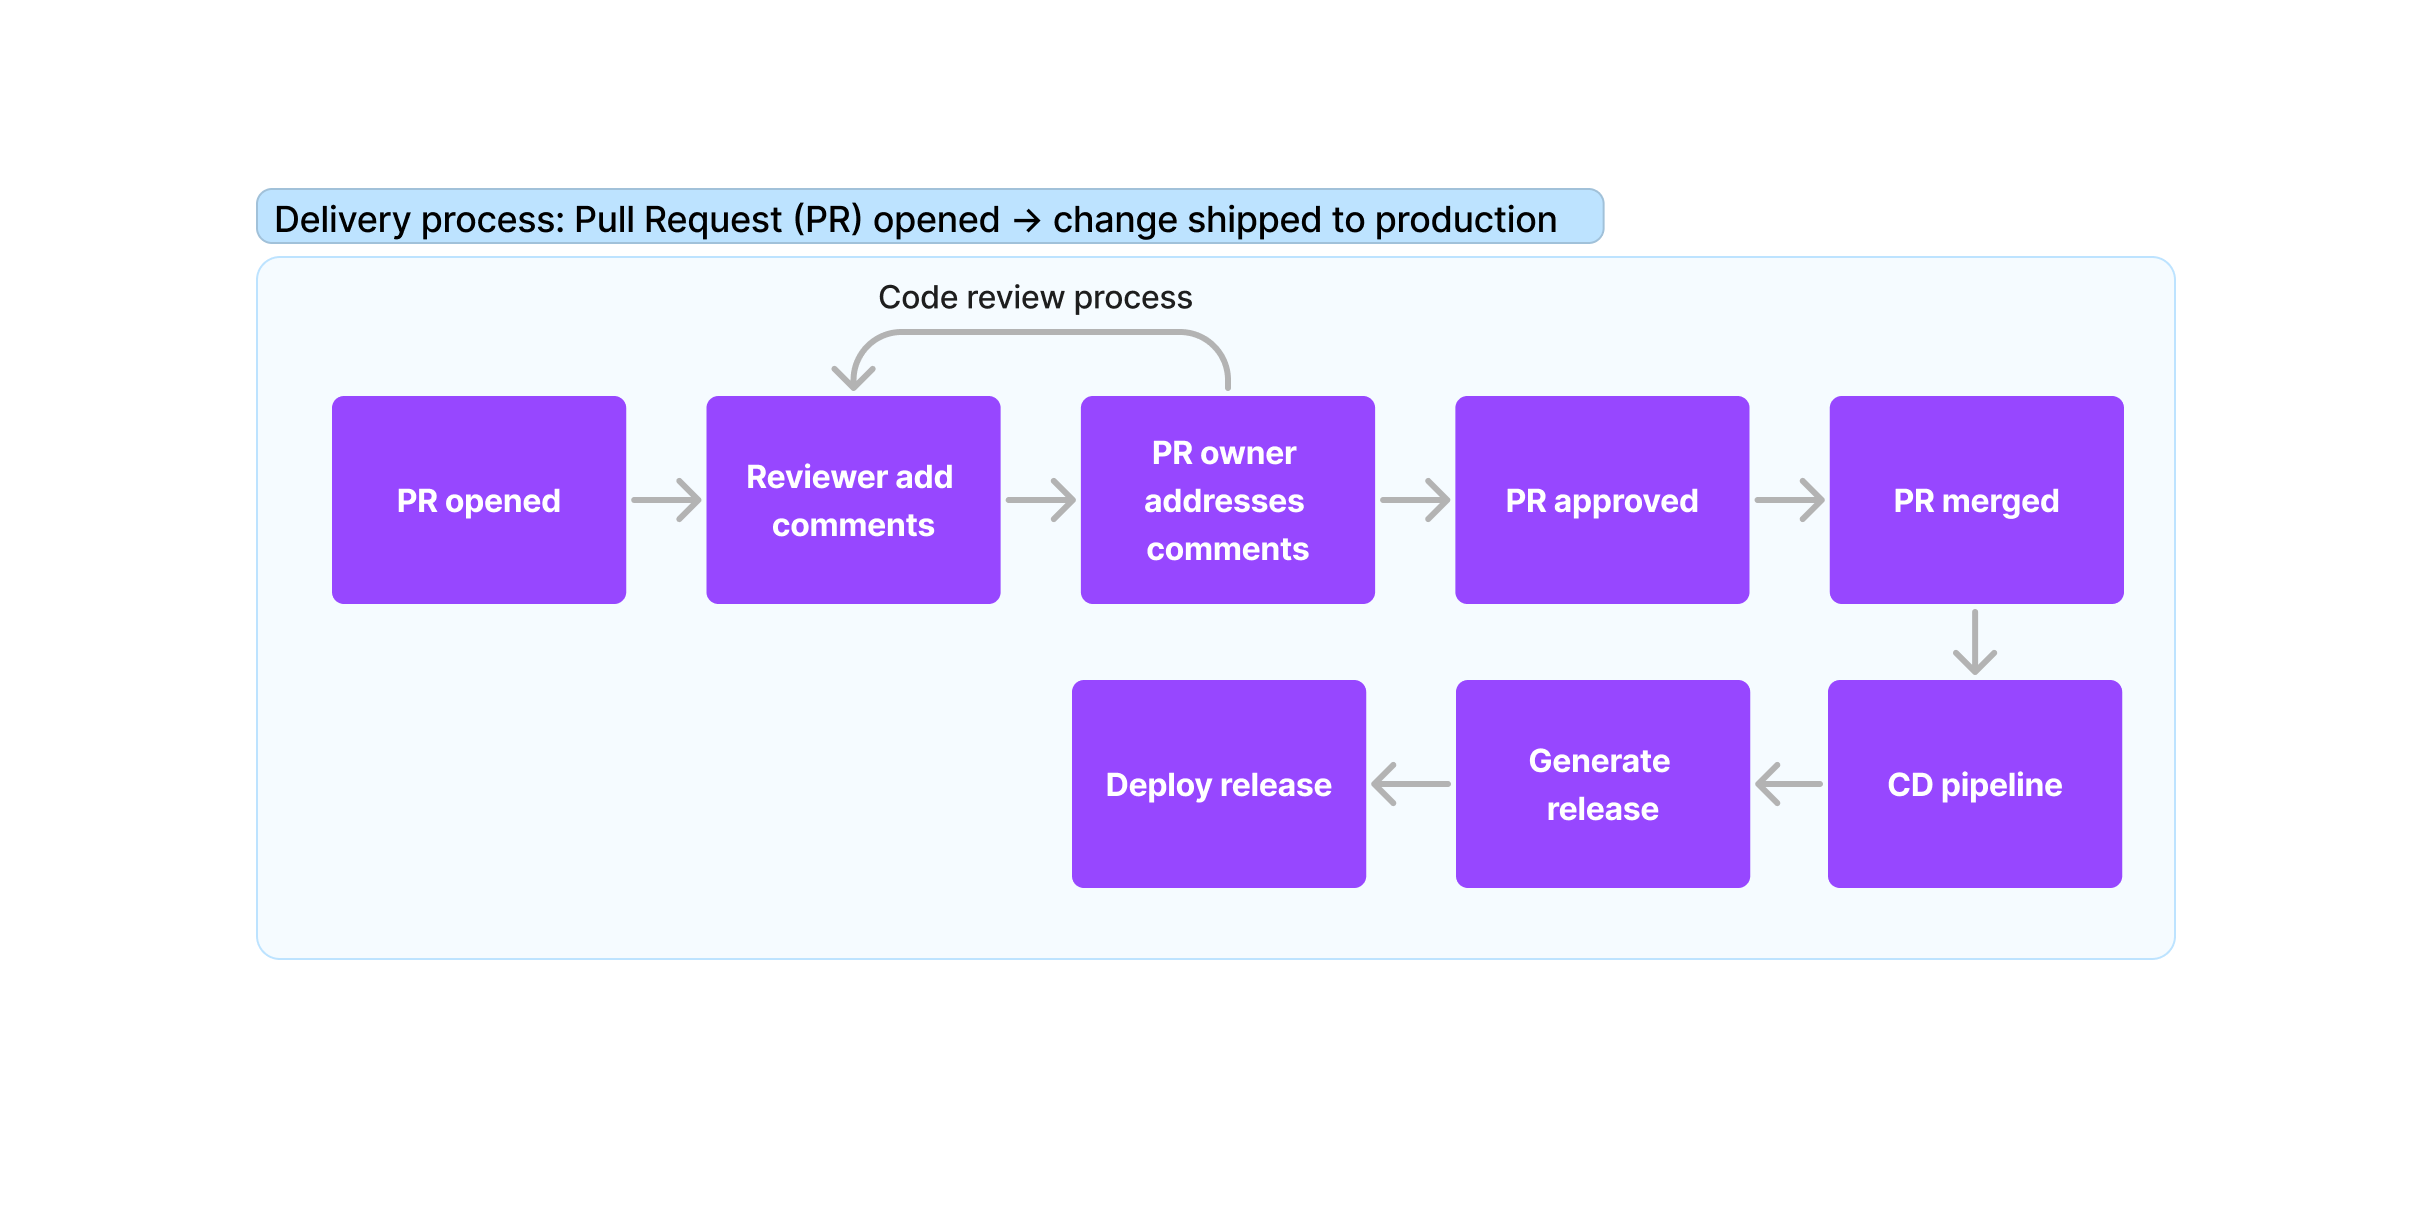
It provides good insights about how to measure the efficiency of your process from a Pull Request being opened until the code changes are shipped to the production environment.
Without going into low-level details, these are the main things that should happen during that process:
The concepts described in that blog post are something that has been running as a background thread in my mind over the last few months, but I am always struggling to invest some time in it.
Until today! I paired with ChatGPT and I hit two targets with one shot.
I was curious about the first part of the diagram above: how long does it take for a Pull Request to get merged in my current project?
I asked:

And GPT replied:
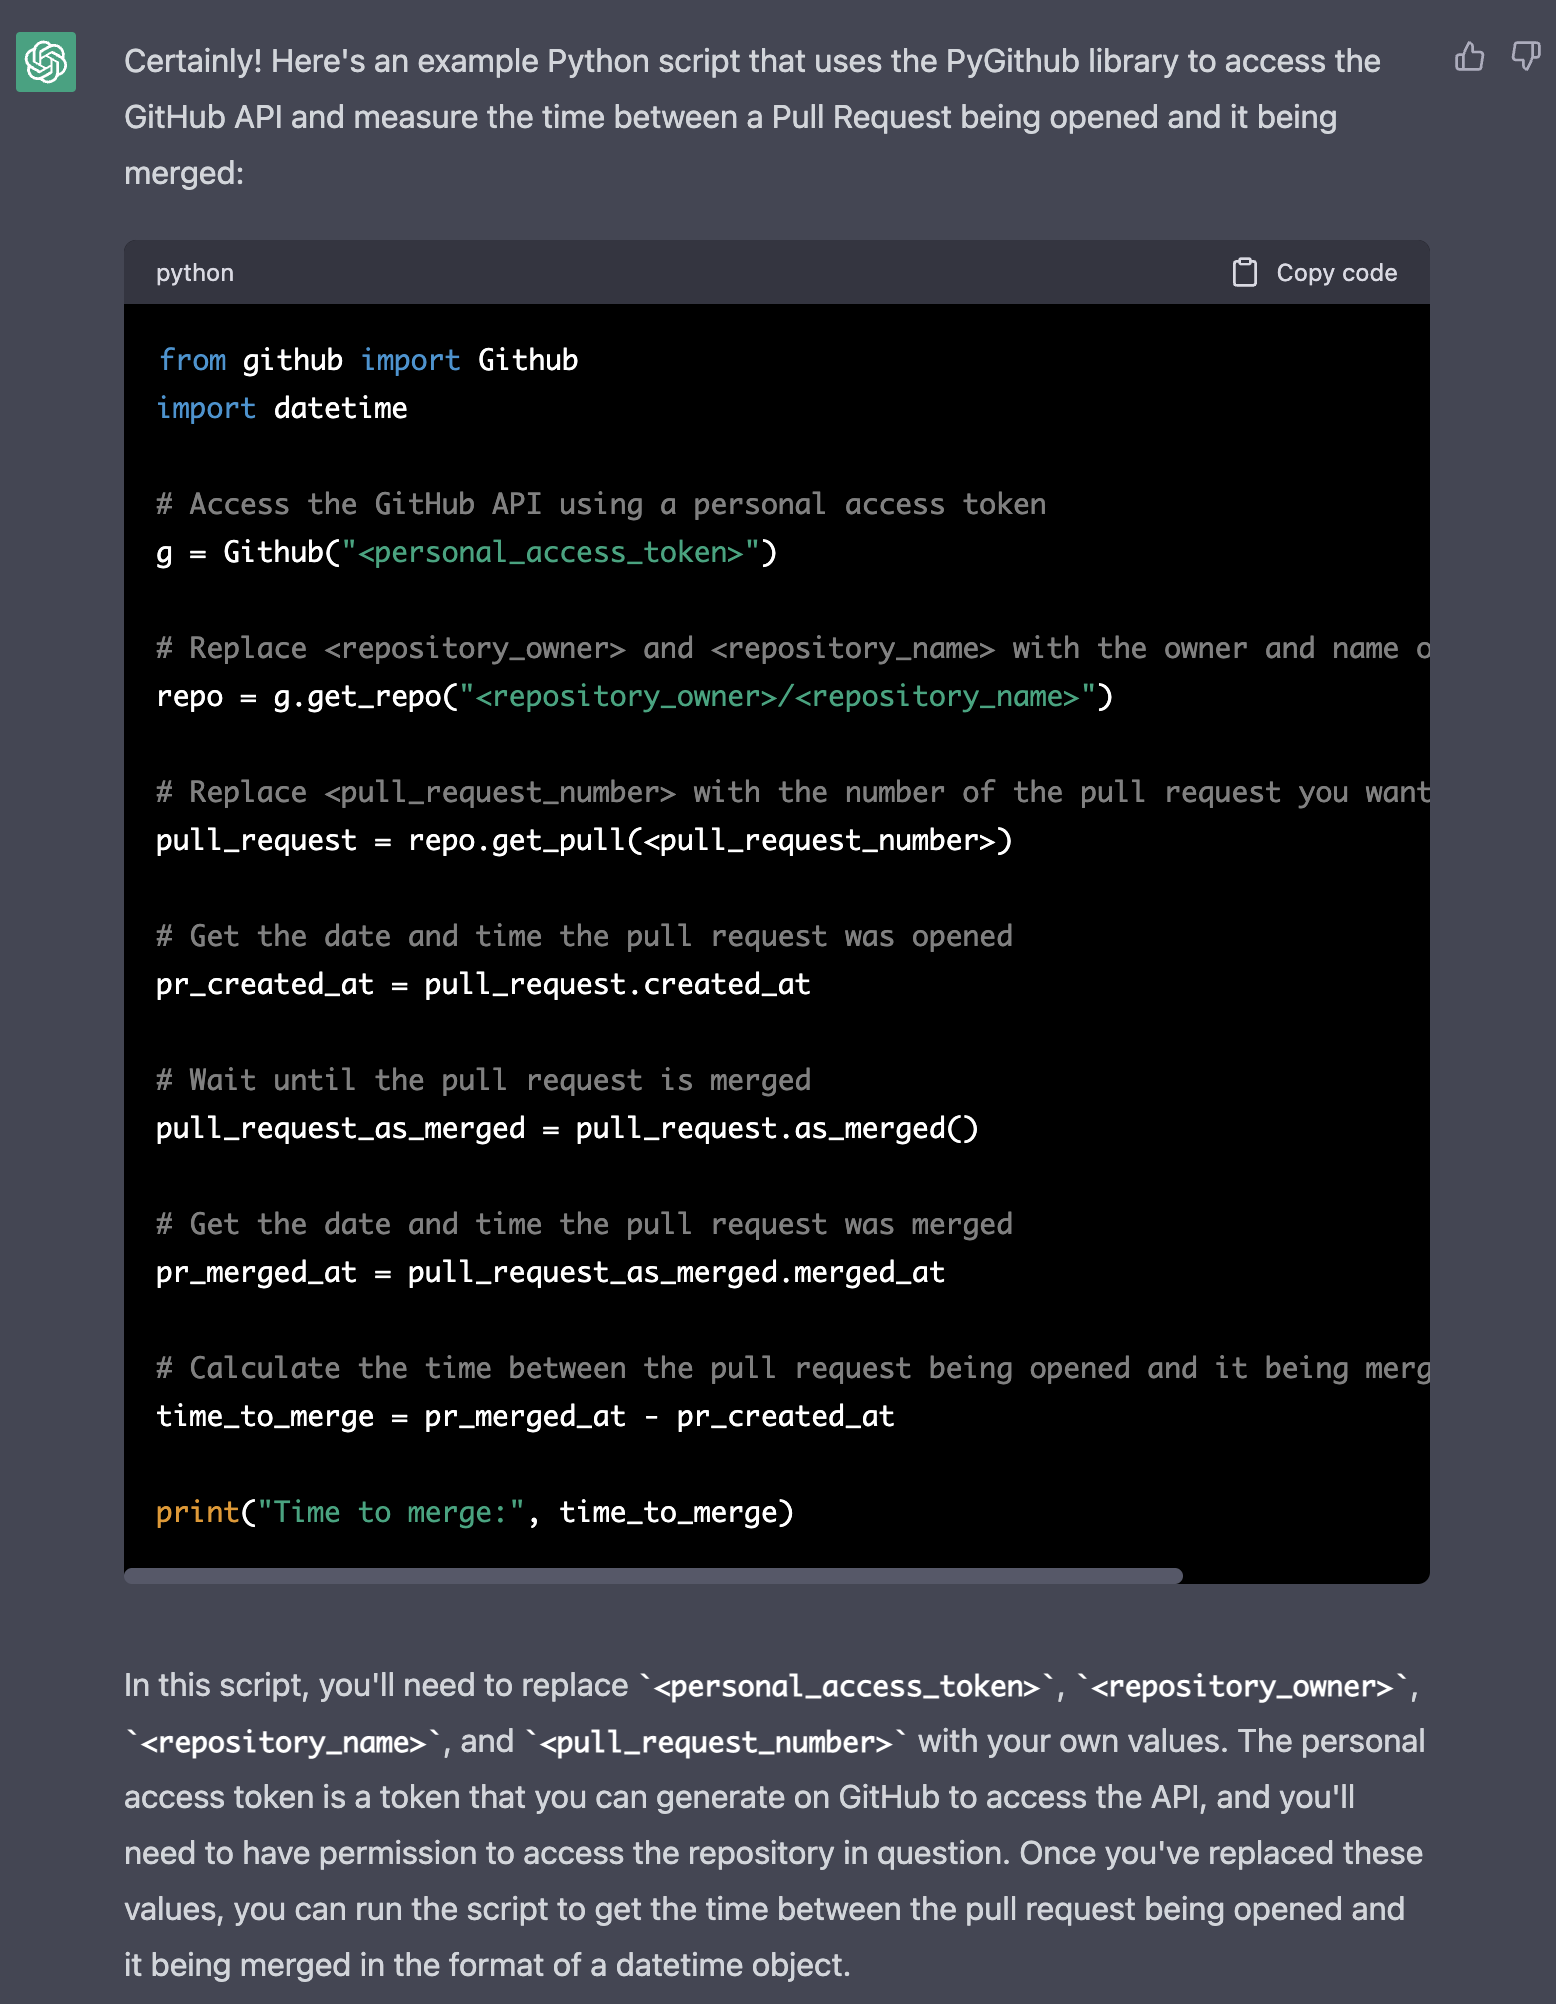
This was a good way to start our relationship for this matter ![]() It helped me to avoid:
It helped me to avoid:
- checking which python library should I use.
- check the github / python library API to understand how to obtain each pull request and its status.
I realized my question was misleading, as it interpreted that I was interested in a specific Pull Request:

And GPT replied:
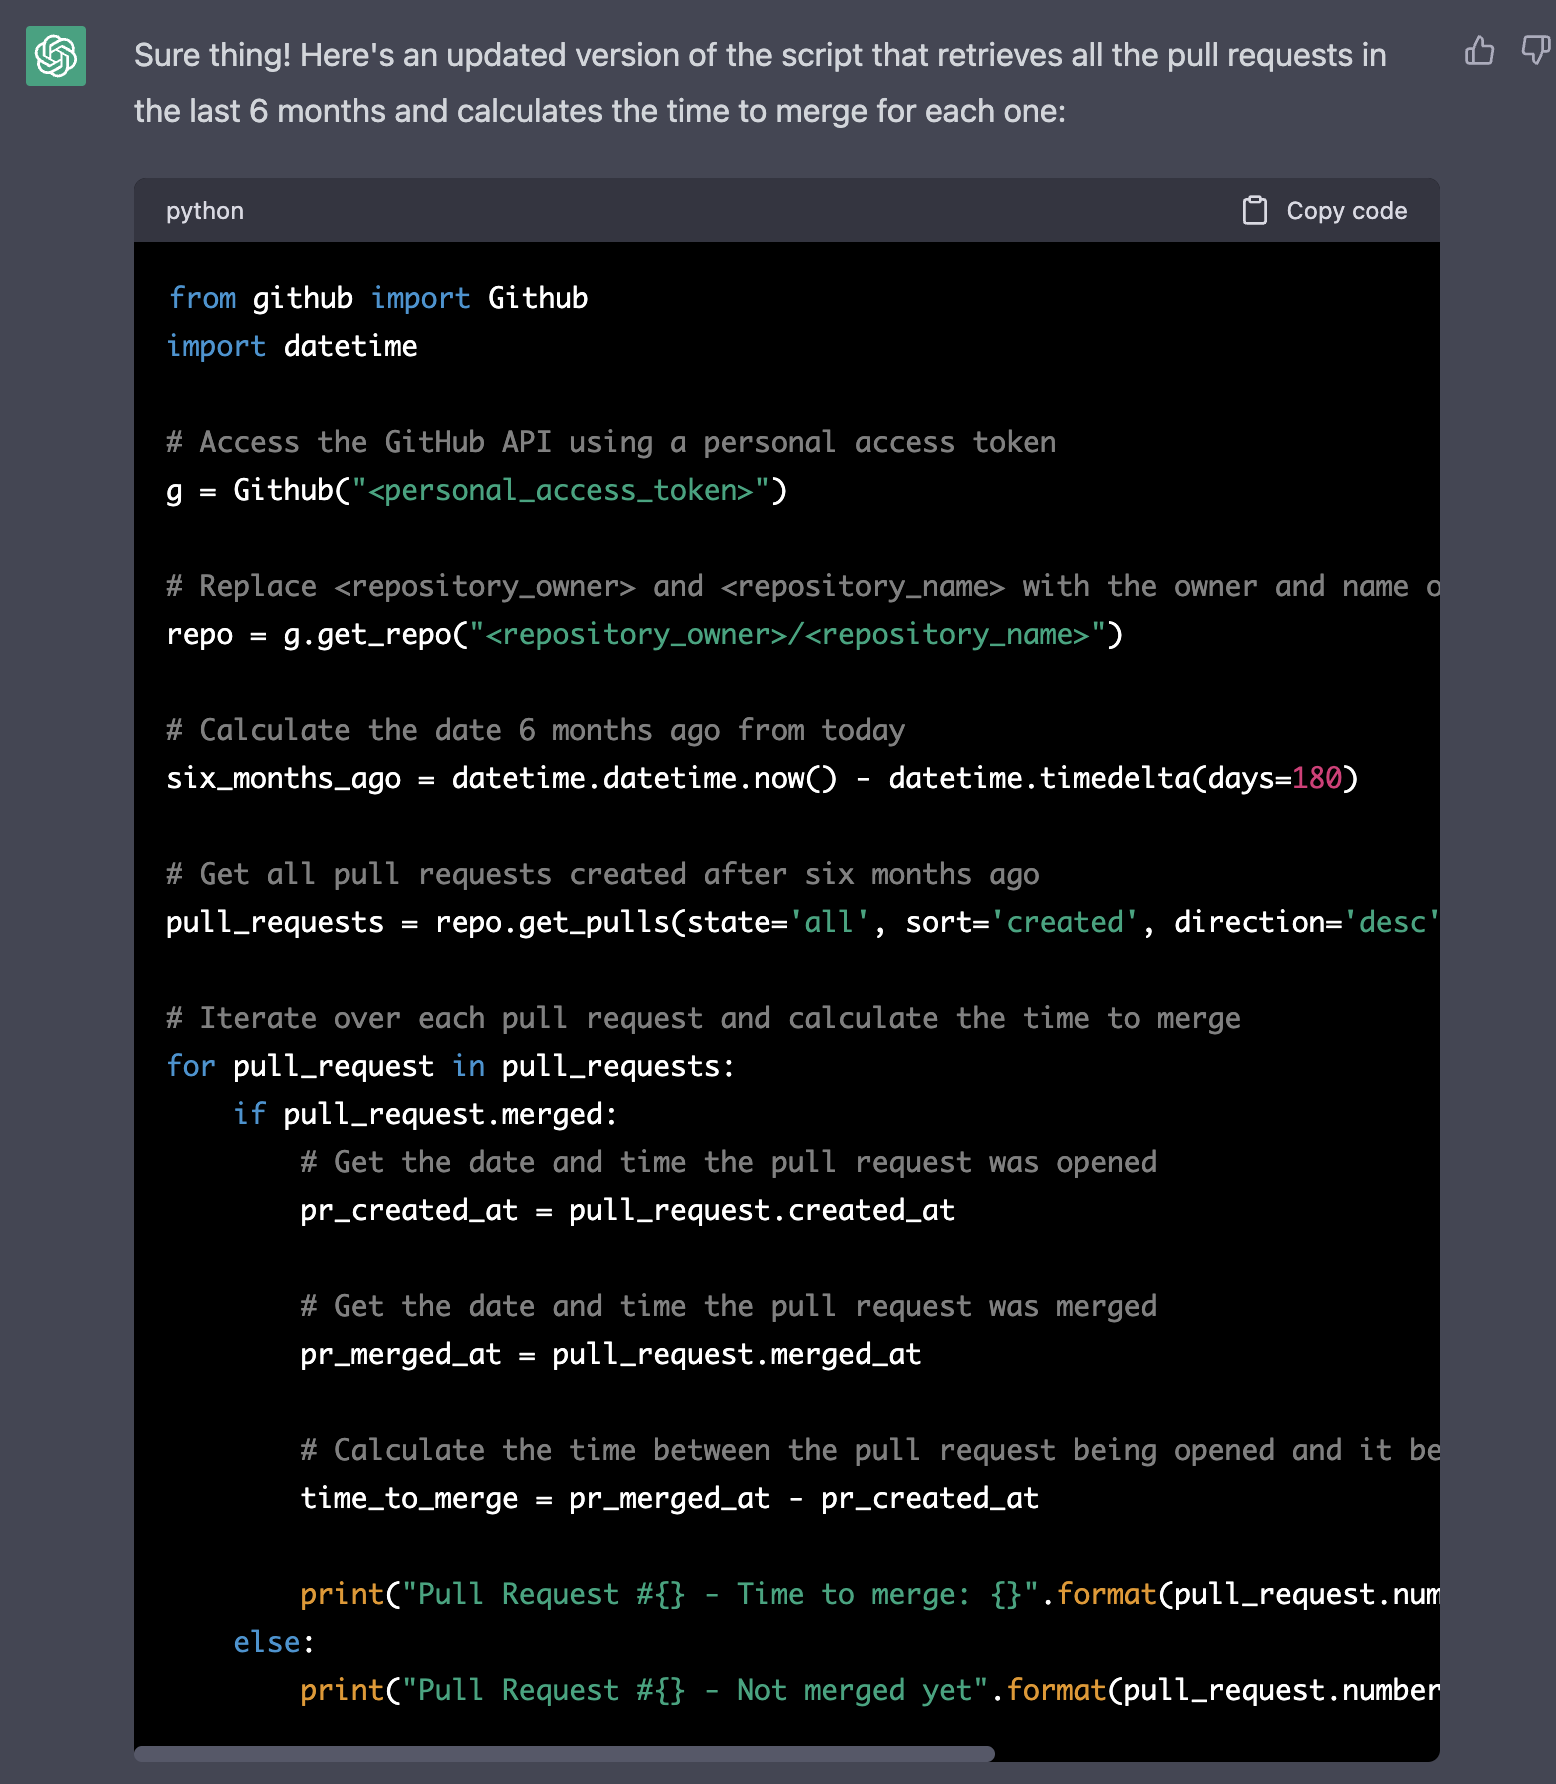
I was so impressed that I didn’t even consider testing the script, I wanted more!

For the sake of readiness, I’ve put its answer in an external gist.
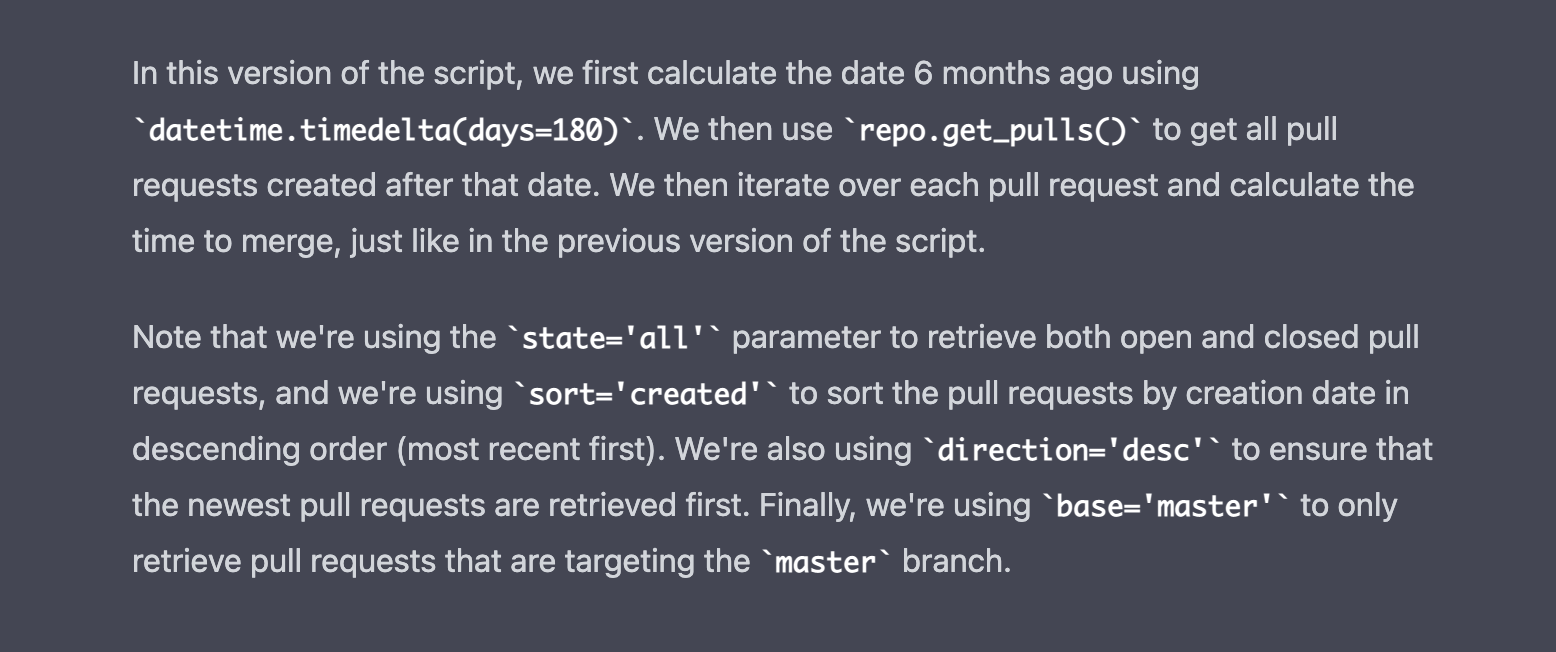
And its explanation:
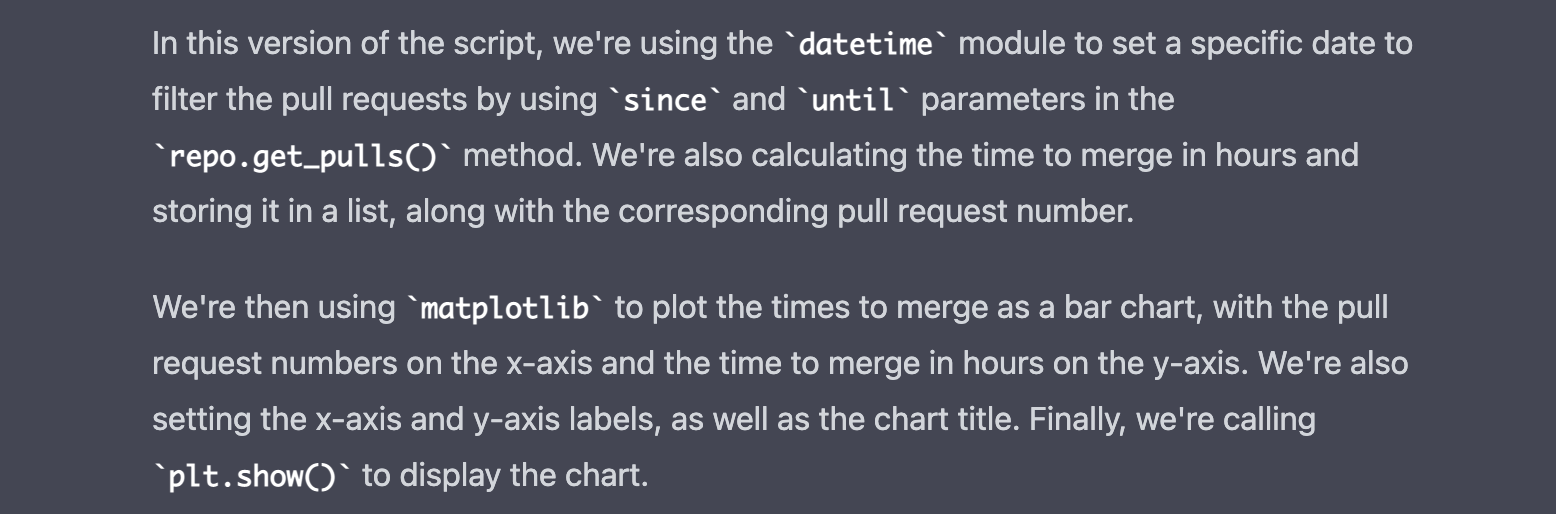
It hadn’t in mind that I was curious about the last six months of activity, and it decided to query Pull Requests from a specific date (yesterday).
So I asked again:

And its answer in an external gist.
It described again the solution, but to be honest I didn’t read it.
At this point, I’m not sure if there’s been a big gain in productivity. Perhaps the major advantage is that I didn’t need to invest some time reviewing a couple of third-party dependencies, but at the same time, I feel I’m trusting blindly what I’m being told.
Unfortunately, things became a bit tedious:

It apologized for the confusion (so cute ![]() ) and pointed to the mistake very fast (incredibly fast!)
) and pointed to the mistake very fast (incredibly fast!)
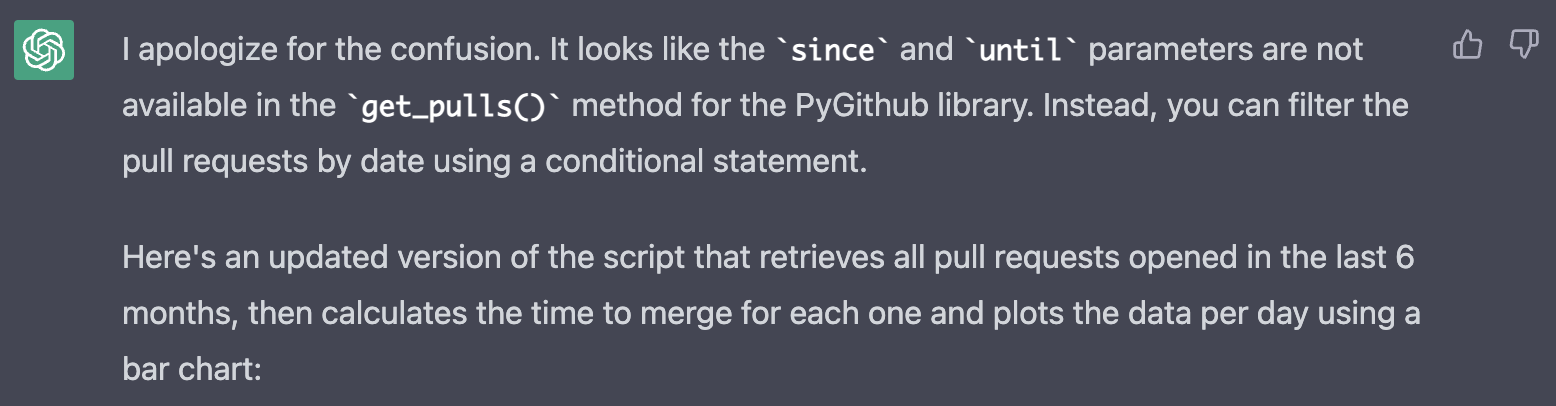
This got me very confused and intrigued. I could understand that ChatGPT knew about since and until attributes in the get_pulls() method if they had existed in previous versions of the PyGithub library and got deprecated for whatever reason in the last version of the library. But that was not the case, they have never existed. So I have no idea why ChatGPT decided to use since. My two theories are that it exists in other libraries and learned from that, or it extrapolated other arguments of the REST
API and adapted its knowledge about the python wrapper. Quite fascinating IMO even though it was wrong this time.
This is the script associated with the response above. Here GPT made a rookie mistake. We are interested in the last 6 months of data, so as soon as one Pull Request is older than that, we can stop iterating over previous data (pull requests are order by time desc).
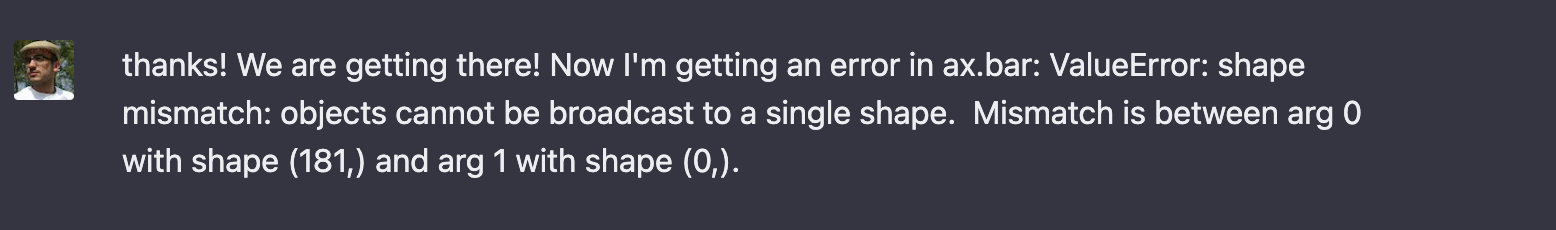
I got a couple of additional errors:
This script is interesting because it forgot to add the last line of the script:
plt.show()This reminded me to don’t trust blindly the machine for now. So I read the script for the first time ![]() and realized we were
retrieving data from the
and realized we were
retrieving data from the master branch. I can understand that because it used to be the default branch name some years ago, but that’s not the
case anymore ![]() .
.
I suggested using main as the default branch instead:

It was very polite, I was liking it a lot:

Going back to my previous problem, it was still happening!

And its answer and the updated script, this time with the last line included!

Here we got an issue that should be easy to spot with the usual linter in your IDE:

And it acknowledged the mistake and provided an updated script.
I was getting a very ugly chart with no data, so I thought maybe we should plot “hours to merge” instead of “days to merge”:

It explained briefly the required changes:
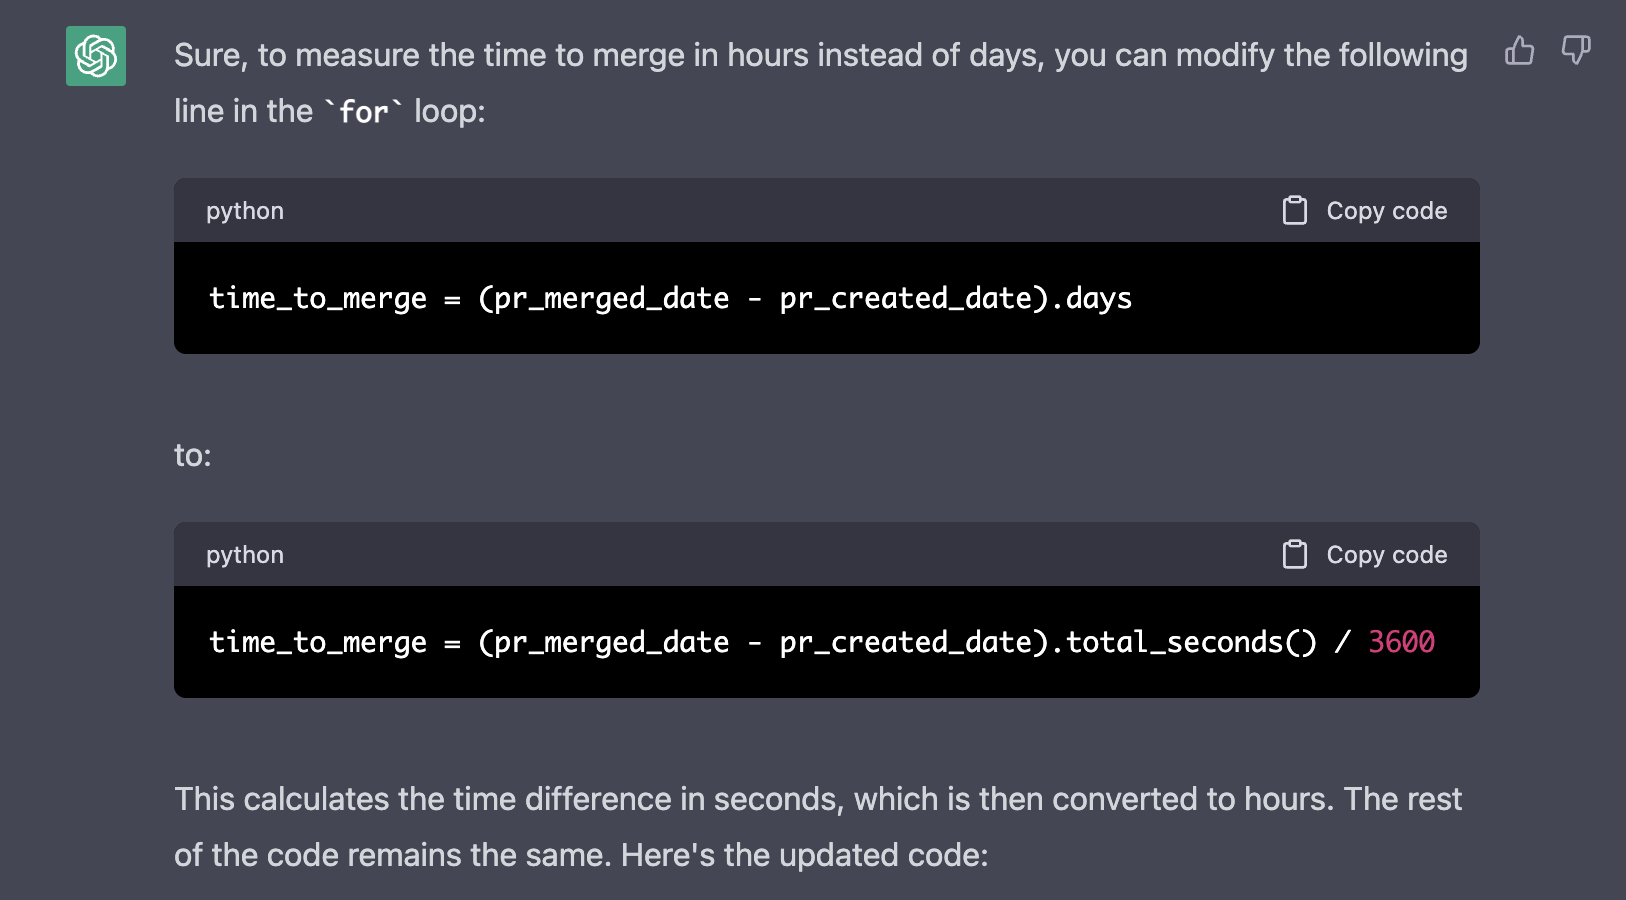
This is the generated script
At this point, I think both of us needed a break ![]() .
.
The chart was still looking pretty bad, so I did what I usually (try to) do in my day-to-day work: read the code, understand what it’s doing, add some helpful debug logs, and find the root cause of what’s going on.

This was still very interesting but was not increasing my productivity anymore. This is its answer:
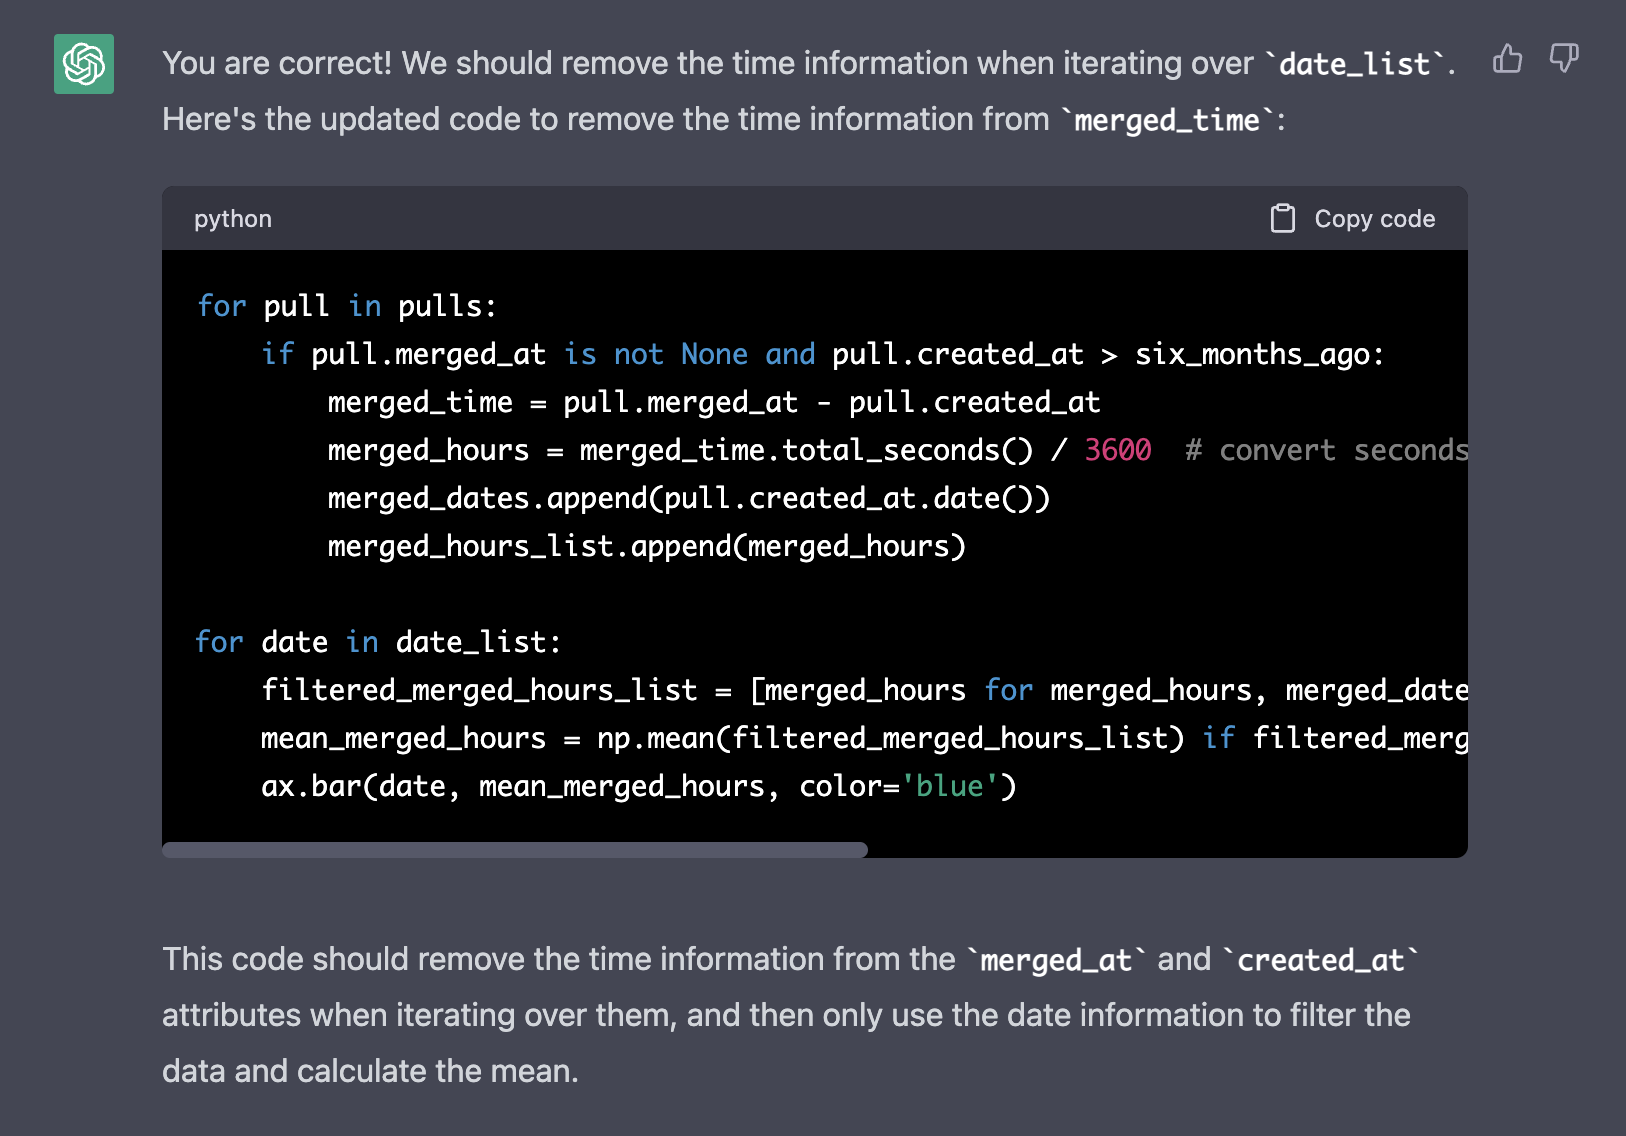
I was shocked ![]() It indeed understood the issue (we were using datetime instead of date to create the buckets) but suddenly
it introduced numpy (
It indeed understood the issue (we were using datetime instead of date to create the buckets) but suddenly
it introduced numpy (np.) in our script.

This is its answer and the script using numpy.
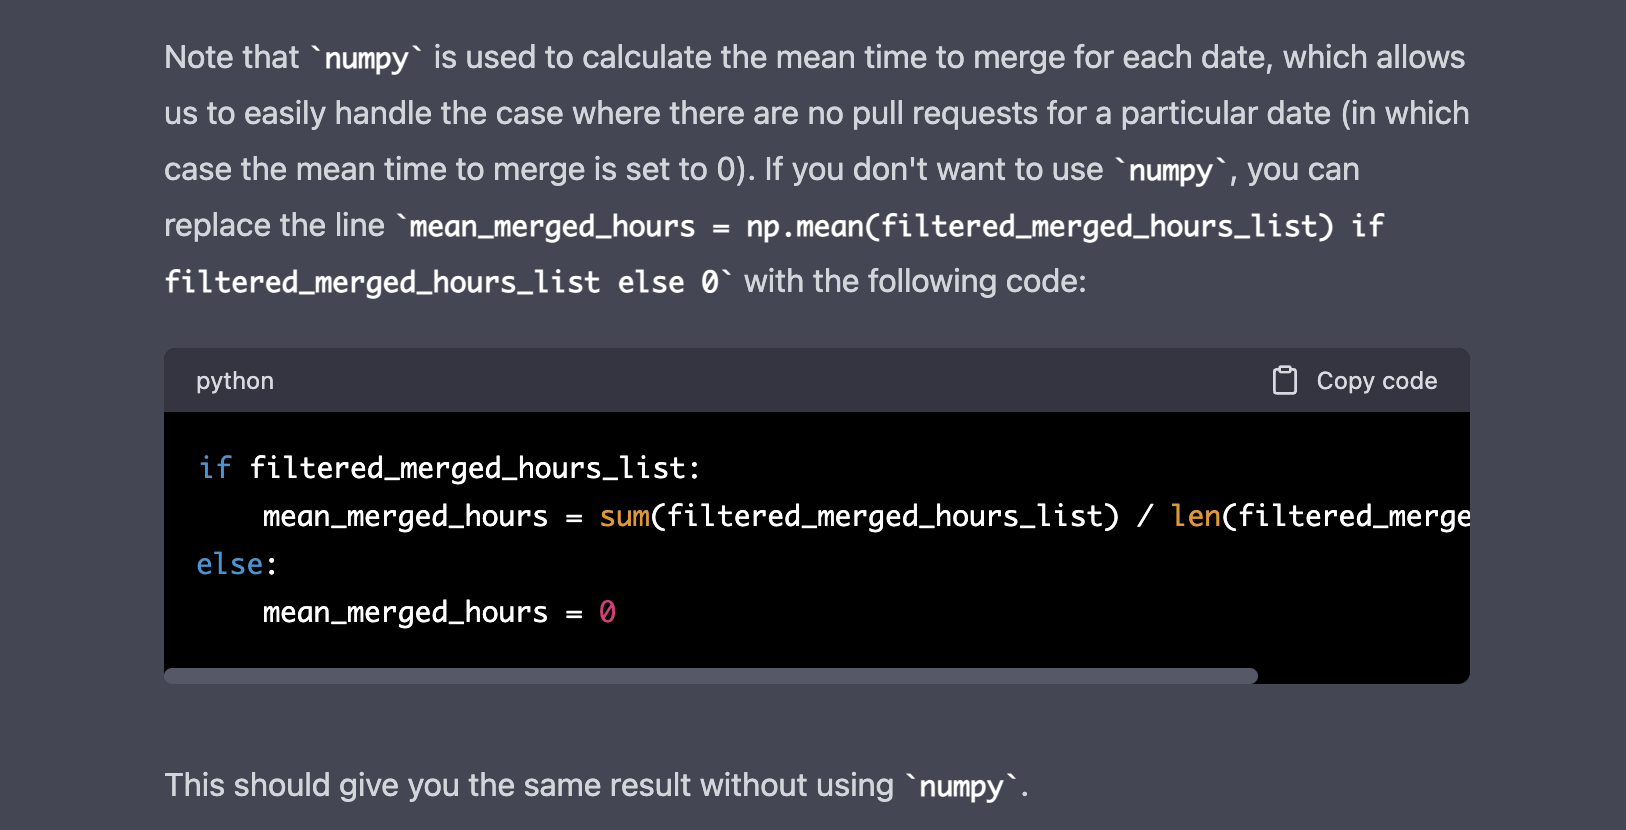
I tested it and it worked ![]() . In less than one hour we had a script to grab the Pull Requests from a specific repo and plot a histogram
with the number of hours it took to merge each Pull Request.
. In less than one hour we had a script to grab the Pull Requests from a specific repo and plot a histogram
with the number of hours it took to merge each Pull Request.
I think the job is still not ended, but it was a good start and I needed a break, so I asked it something different to have some social time together:
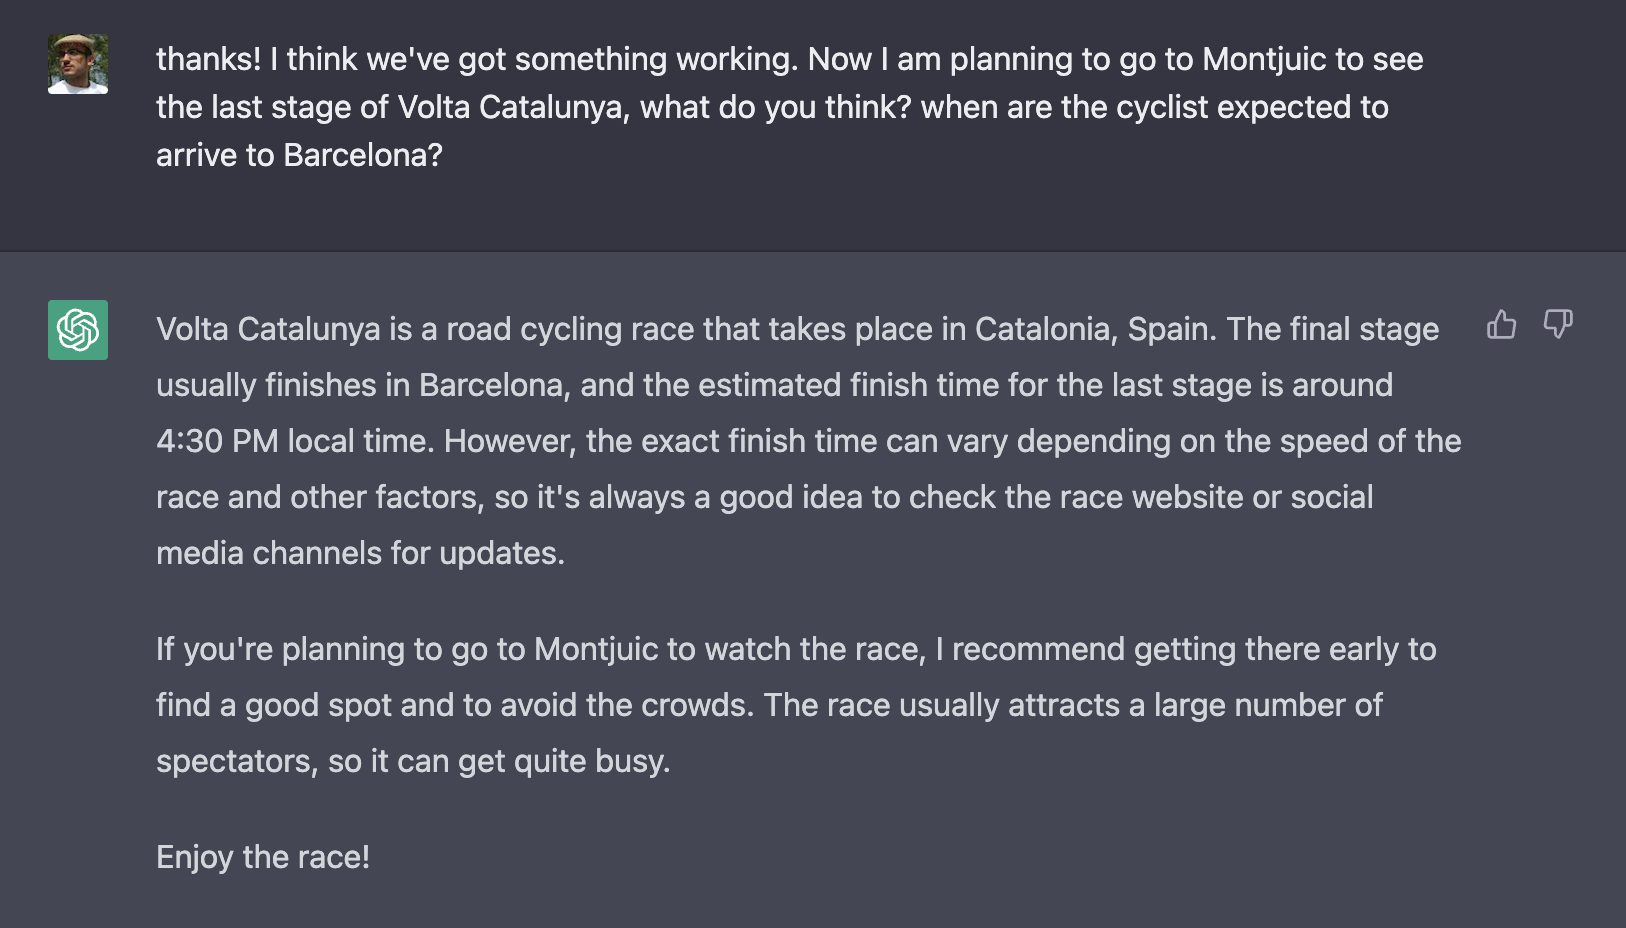
I left home at 11:00 am and the cyclist arrived at 12:30 pm. I was lucky I didn’t trust it blindly.

« Home